API Documentation
Tool for creating sketches of physical and mathematical problems in Python code.
- class pysketcher.Angle(value)[source]
Bases:
floatA representation of a 2-Dimensional Angle.
An
Angleis a float which is limited in value to between and
and  . Values outside of this range have
  either added
or subtracted repeatedly until they are within this bound.
either added
or subtracted repeatedly until they are within this bound.- Parameters:
value (float) – The value of the angle to create.
- Return type:
Examples
>>> Angle(1.0)
Angle(1.0)
>>> Angle(np.pi / 2)
Angle(1.5707963267948966)
>>> Angle(123)
Angle(-2.6637061435917246)
>>> Angle(2 * np.pi)
Angle(0.0)
- class pysketcher.AngularDimension(text, start, end, center)[source]
Bases:
CompositionUsed to indicate the angle between two points about a given center.
- Parameters:
returns: A composition.
Examples
>>> arc1 = ps.Arc(ps.Point(0.25, 0.25), 1.0, ps.Angle(0.0), ps.Angle(np.pi / 2))
>>> arc1.style.line_color = ps.Style.Color.BLUE
>>> dim1 = ps.AngularDimension("$a$", arc1.start, arc1.end, arc1.center)
>>>
>>> arc2 = ps.Arc(
...     ps.Point(0.25, -0.25), 1.0, ps.Angle(0.0), ps.Angle(-np.pi / 2)
... )
>>> arc2.style.line_color = ps.Style.Color.GREEN
>>> dim2 = ps.AngularDimension("$b$", arc2.start, arc2.end, arc2.center)
>>>
>>> arc3 = ps.Arc(
...     ps.Point(-0.25, 0.25), 1.0, ps.Angle(np.pi / 2), ps.Angle(np.pi / 2)
... )
>>> arc3.style.line_color = ps.Style.Color.RED
>>> dim3 = ps.AngularDimension("$c$", arc3.start, arc3.end, arc3.center)
>>>
>>> fig = ps.Figure(-2.0, 2.0, -2.0, 2.0, backend=MatplotlibBackend)
>>> fig.add(arc1)
>>> fig.add(dim1)
>>> fig.add(arc2)
>>> fig.add(dim2)
>>> fig.add(arc3)
>>> fig.add(dim3)
>>> fig.save("pysketcher/images/angular_dimension.png")
- class pysketcher.Arc(center, radius, start_angle, arc_angle, resolution=180)[source]
Bases:
CurveA representation of a continuous connected subset of a circle.
- Parameters:
Examples
>>> arc = ps.Arc(ps.Point(0.0, 0.0), 1.0, Angle(0.0), Angle(np.pi / 2))
>>> fig = ps.Figure(-0.5, 1.5, -0.5, 1.5, backend=MatplotlibBackend)
>>> fig.add(arc)
>>> fig.save("pysketcher/images/arc.png")
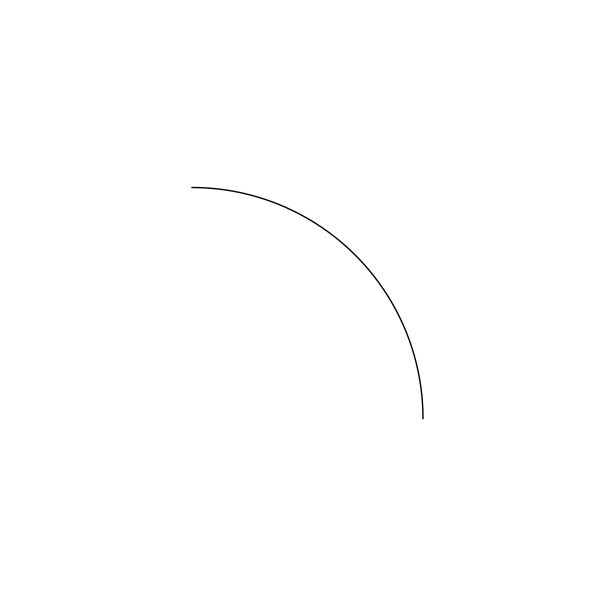
An example of an
Arc.
- class pysketcher.ArcAnnotation(text, arc, text_position=TextPosition.MIDDLE)[source]
Bases:
TextAnnotates an arc with the provided text.
- Parameters:
text (str)
arc (Arc)
text_position (TextPosition)
- class pysketcher.Arrow(start, end)[source]
Bases:
LineDraw an arrow as Line with arrow pointing towards end.
Examples
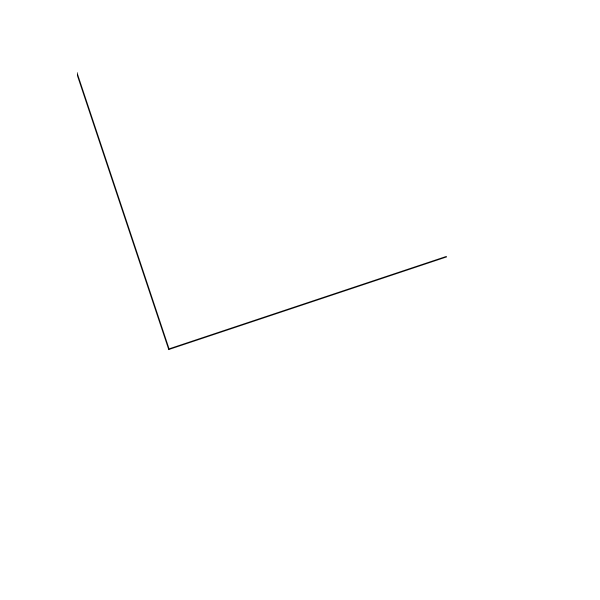
>>> up_arrow = ps.Arrow(ps.Point(0.0, 1.0), ps.Point(0.0, 3.0))
>>> down_arrow = ps.Arrow(ps.Point(0.0, -1.0), ps.Point(0.0, -3.0))
>>> left_arrow = ps.Arrow(ps.Point(-1.0, 0.0), ps.Point(-3.0, 0.0))
>>> right_arrow = ps.Arrow(
...     ps.Point(1.0, 0.0),
...     ps.Point(3.0, 0.0),
... )
>>> fig = ps.Figure(-4.0, 4.0, -4.0, 4.0, backend=MatplotlibBackend)
>>> fig.add(up_arrow)
>>> fig.add(down_arrow)
>>> fig.add(left_arrow)
>>> fig.add(right_arrow)
>>> fig.save("pysketcher/images/arrow.png")
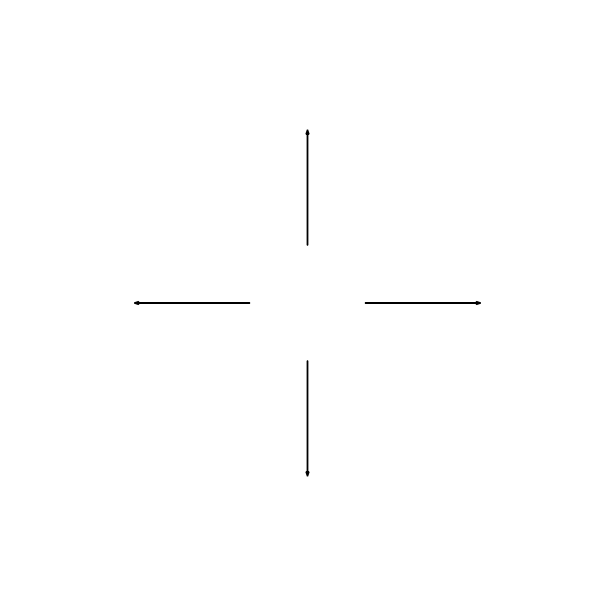
An example of
Arrow.
- class pysketcher.Axis(start, length, label, rotation_angle=Angle(0.0))[source]
Bases:
CompositionA representation of a axis.
Draw axis from start with length to the right (x axis). Place label at the end of the arrow tip. Then return rotation_angle (in degrees). The label_spacing denotes the space between the label and the arrow tip as a fraction of the length of the plot in x direction. A tuple can be given to adjust the position in both the x and y directions (with one parameter, the x position is adjusted).
- class pysketcher.Circle(center, radius, resolution=180)[source]
Bases:
ArcA representation of a 2D circle.
- Parameters:
center (Point) – The center of the circle.
radius (float) – The radius of the circle.
Examples
>>> circle = ps.Circle(ps.Point(1.5, 1.5), 1)
>>> fig = ps.Figure(0, 3, 0, 3, backend=MatplotlibBackend)
>>> fig.add(circle)
>>> fig.save("pysketcher/images/circle.png")
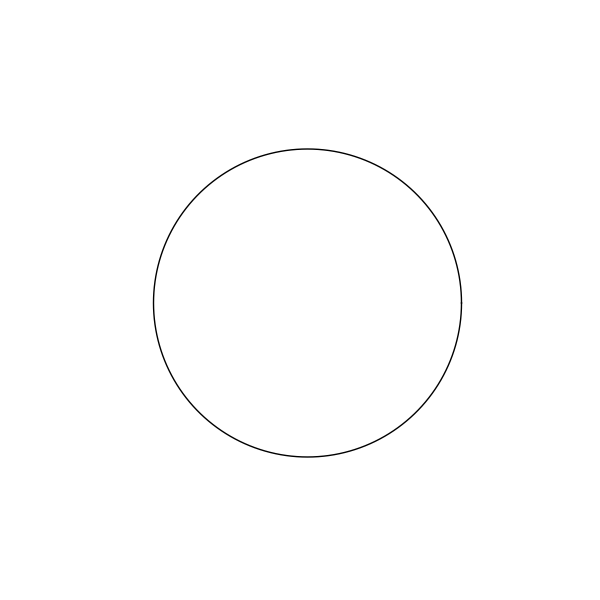
An example of
Circle.
- class pysketcher.Composition(shapes)[source]
Bases:
StylableProvides a convenient means to group shapes together.
- Parameters:
shapes (Dict[str, Shape])
- class CompositionStyle(composition)[source]
Bases:
StylePresents the Stylable contract for a Composition.
Sets the style of each object in the composition transparently.
- Parameters:
composition (Composition)
- property arrow: ArrowStyle[source]
The arrow nature of all
Shapesin the composition.
- property fill_pattern: FillPattern[source]
The fill pattern of all
Shapesin the composition.
- add(key, shape)[source]
Adds a shape to the composition.
- Parameters:
key (str) – the name of the shape to be added
shape (Shape) – the shape to be added.
- Returns:
a copy of the composition with the requisite shape added
- Return type:
- apply(func)[source]
Applies a function to every member of a
Composition.- Parameters:
func (Callable[[Shape | Text | Composition], T]) – The function to apply.
- Returns:
A dictionary of results.
- Return type:
Dict[str, T]
- merge(comp)[source]
Merge two compositions.
- Parameters:
comp (Composition) – the composition to merge with this one.
- Returns:
a new composition made up of this one and the provided one.
- Return type:
- rotate(angle, center)[source]
Rotate the composition.
- Parameters:
angle (float) – The
Anglein radians through which the shape should be rotated.center (Point) – The
Pointabout which the rotation should be performed.
- Returns:
A copy of the
Compositionrotated throughangleaboutcenter.- Return type:
- scale(factor)[source]
Scale the composition.
- Parameters:
factor – The factor by which the
Compositionshould be scaled.- Returns:
A copy of the
Compositionscaled byfactor.- Return type:
- class pysketcher.CubicBezier(start, points, resolution=50)[source]
Bases:
CurveA cubic bezier curve implementation.
Examples
>>> s = ps.CubicBezier(
...     ps.Point(0, 0), [(ps.Point(1, 1), ps.Point(2.5, 0.5), ps.Point(2, 2.5))]
... )
>>> fig = ps.Figure(-0.5, 3.0, -0.5, 3.0, backend=MatplotlibBackend)
>>> fig.add(s)
>>> fig.save("pysketcher/images/cubic_bezier.png")
An example of
CubicBezier.
- class pysketcher.Curve(points)[source]
Bases:
ShapeGeneral curve as a sequence of (x,y) coordintes.
Examples
>>> code = ps.Curve(
...     [
...         ps.Point(0, 0),
...         ps.Point(1, 1),
...         ps.Point(2, 4),
...         ps.Point(3, 9),
...         ps.Point(4, 16),
...     ]
... )
>>> code.style.line_color = ps.Style.Color.BLACK
>>> model = ps.Composition(dict(text=code))
>>> fig = ps.Figure(0, 5, 0, 16, backend=MatplotlibBackend)
>>> fig.add(model)
>>> fig.save("pysketcher/images/curve.png")
An example of
Curve.¶- Parameters:
points (List[Point])
- scale(factor)[source]
Scale all coordinates by factor:
x = factor*x, etc.- Parameters:
factor (float)
- Return type:
- class pysketcher.Dashpot(start, total_length, bar_length=None, width=None, dashpot_length=None, piston_pos=None)[source]
Bases:
CompositionA representation of a dashpot.
Specify a vertical dashpot of height total_length and start as bottom/starting point. The first bar part has length bar_length. Then comes the dashpot as a rectangular construction of total width width and height dashpot_length. The position of the piston inside the rectangular dashpot area is given by piston_pos, which is the distance between the first bar (given by bar_length) to the piston. If some of dashpot_length, bar_length, width or piston_pos are not given, suitable default values are calculated.
- Parameters:
start (Point) – The starting point of the Dashpot.
total_length (float) – The total length of the Dashpot including bar.
bar_length (float) – The length of the bar.
width (float) – The width of the dashpot.
dashpot_length (float) – The length of the Dashpot excluding bar.
piston_pos (float) – The position of the piston. Defaults to 1/3 length.
Examples
>>> L = 12.0
>>> H = L / 6.0
>>> x = L / 2.0
>>> d_start = ps.Point(0, 0)
>>> d = ps.Dashpot(d_start, L + x)
>>> fig = ps.Figure(-3, 3, -1, 13, backend=MatplotlibBackend)
>>> fig.add(d)
>>> fig.save("pysketcher/images/dashpot.png")

An example of
Dashpot.
- class pysketcher.DoubleArrow(start, end)[source]
Bases:
LineDraw an arrow as Line with arrow pointing towards start and end.
- Parameters:
Examples
>>> double_arrow = ps.DoubleArrow(
...     ps.Point(1.0, 1.0),
...     ps.Point(
...         3.0,
...         1.0,
...     ),
... )
>>> fig = ps.Figure(0.0, 4.0, 0.0, 2.0, backend=MatplotlibBackend)
>>> fig.add(double_arrow)
>>> fig.save("pysketcher/images/double_arrow.png")
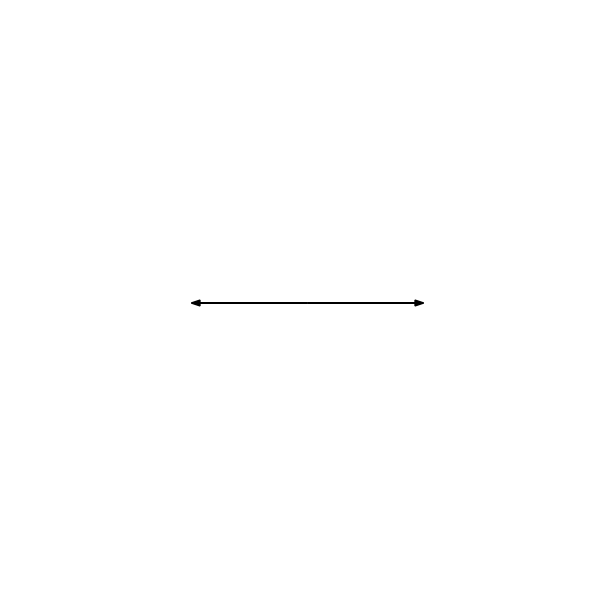
An example of
DoubleArrow.
- class pysketcher.Figure(x_min, x_max, y_min, y_max, backend)[source]
Bases:
objectProvides the developer interface to the pysketcher backends.
Provides the means to render models into either viewable, or savable (or both) images depending on which backend is chosen.
- Parameters:
x_min (float) – The minimum x-coordinate that will be rendered.
x_max (float) – The maximum x-coordinate that will be rendered.
y_min (float) – The minimum y-coordinate that will be rendered.
y_max (float) – The maximum y-coordinate that will be rendered.
backend (Type[Backend])
Examples
>>> circle = ps.Circle(ps.Point(1.5, 1.5), 1)
>>> fig = ps.Figure(0, 3, 0, 3, backend=MatplotlibBackend)
>>> fig.add(circle)
>>> fig.save("pysketcher/images/figure.png")

An example of
Figure.¶- add(shape)[source]
Adds a shape to the Figure.
Once the shape is added, when :method:
saveor :method:showis called, the portion of the shape which is within the bounds of the figure will be included in the image.- Parameters:
shape (Shape | Text | Composition) – The shape which should be added to the figure.
- Return type:
None
- animate(func, interval)[source]
Renders an animation from the provided function.
If the backend supports it, then an animation will be rendered and stored internally by the backend.
- Parameters:
func (Callable[[float], Shape | Text | Composition]) – This function takes a parameter and provides a Drawable for that parameter value.
interval (Tuple[float, float] | Tuple[float, float, float]) – the start and end values for the parameter and an optional increment. If the increment is not provided, the parameter will be incremented by 1.
- save(filename)[source]
Saves the rendered figure to a file.
If the backed supports it, then an image will be saved to the location specified in
filename.- Parameters:
filename (str) – The location to which the figure should be saved.
- Return type:
None
- class pysketcher.Force(text, start, end, text_position=TextPosition.MIDDLE)[source]
Bases:
CompositionA composition of Arrow and LinearAnnotation.
- Parameters:
text (str)
start (Point)
end (Point)
text_position (TextPosition)
- class pysketcher.Gravity(start, length)[source]
Bases:
ForceDownward-pointing gravity arrow with the symbol g.
- class pysketcher.Line(start, end)[source]
Bases:
CurveA representation of a line primitive.
- Parameters:
Example
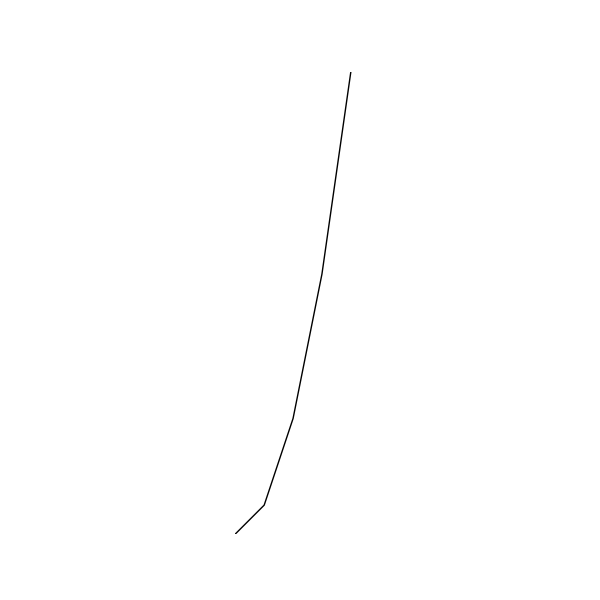
>>> a = ps.Line(ps.Point(1.0, 2.0), ps.Point(4.0, 3.0))
>>> b = a.rotate(np.pi / 2, ps.Point(1.0, 2.0))
>>> fig = ps.Figure(0, 5, 0, 5, backend=MatplotlibBackend)
>>> fig.add(a)
>>> fig.add(b)
>>> fig.save("pysketcher/images/line.png")
An example of
Line.¶- interval(x_range=None, y_range=None)[source]
Returns a smaller portion of a line.
- Parameters:
x_range (Tuple[float, float]) – The range of x-coordinates which should be used to obtain the segment
y_range (Tuple[float, float]) – The range of y-coordinates which should be used to obtain the segment
- Returns:
A line bounded to either
x_rangeory_range.- Raises:
ValueError – If the line is vertical and
x_rangeis provided, or if the line is horizontal andy_rangeis provided.
- class pysketcher.LineAnnotation(text, line, text_position=TextPosition.MIDDLE)[source]
Bases:
TextAnnotates a line with the provided text.
- Parameters:
text (str)
line (Line)
text_position (TextPosition)
- class pysketcher.LinearDimension(text, start, end, offset_style=OffsetStyle.ALIGNED)[source]
Bases:
CompositionUsed to indicate the linear distance between two points.
Examples
>>> triangle1 = ps.Triangle(ps.Point(1, 1), ps.Point(1, 2), ps.Point(3, 1))
>>> dim1 = LinearDimension(r"$c$", ps.Point(3, 1), ps.Point(1, 2))
>>> text1 = ps.Text("Aligned", ps.Point(2, 0.5))
>>>
>>> triangle2 = ps.Triangle(ps.Point(5, 1), ps.Point(5, 2), ps.Point(7, 1))
>>> dim2 = LinearDimension(r"$a$", ps.Point(7, 1), ps.Point(5, 2))
>>> dim2.offset_style = LinearDimension.OffsetStyle.HORIZONTAL
>>> text2 = ps.Text("Horizontal", ps.Point(6, 0.5))
>>>
>>> triangle3 = ps.Triangle(ps.Point(9, 1), ps.Point(9, 2), ps.Point(11, 1))
>>> dim3 = LinearDimension(r"$b$", ps.Point(11, 1), ps.Point(9, 2))
>>> dim3.offset_style = LinearDimension.OffsetStyle.VERTICAL
>>> text3 = ps.Text("Vertical", ps.Point(10, 0.5))
>>>
>>> fig = ps.Figure(0, 13, 0, 3, backend=MatplotlibBackend)
>>> fig.add(triangle1)
>>> fig.add(dim1)
>>> fig.add(text1)
>>> fig.add(triangle2)
>>> fig.add(dim2)
>>> fig.add(text2)
>>> fig.add(triangle3)
>>> fig.add(dim3)
>>> fig.add(text3)
>>> fig.save("pysketcher/images/linear_dimension.png")
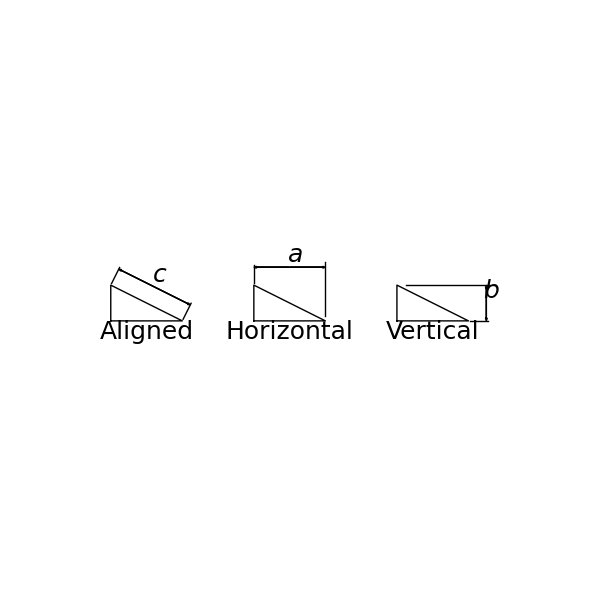
An example of
LinearDimension.¶- Parameters:
text (str)
start (Point)
end (Point)
offset_style (OffsetStyle)
- class OffsetStyle(value, names=None, *, module=None, qualname=None, type=None, start=1, boundary=None)[source]
Bases:
EnumThe style of offset in a Linear dimension.
- property offset_style: OffsetStyle[source]
Specifies the orientation of the drawn dimension.
- class pysketcher.Moment(text, center, radius)[source]
Bases:
CompositionA symbol which represents a moment.
This is an
ArcWithTextwith thearc_anglefixed at.- Parameters:
text – The text to display.
center – The centre of the moment.
radius – The radius of the moment.
start_angle – The angle from the +ve horizontal at which the moment should start.
text_spacing – The spacing of the text.
resolution – The number of points on the arc.
Examples
>>> moment = ps.Moment("$M$", ps.Point(0, 0), 1.0)
>>> fig = ps.Figure(-1.2, 1.2, -1.2, 1.2, backend=MatplotlibBackend)
>>> fig.add(moment)
>>> fig.save("pysketcher/images/moment.png")
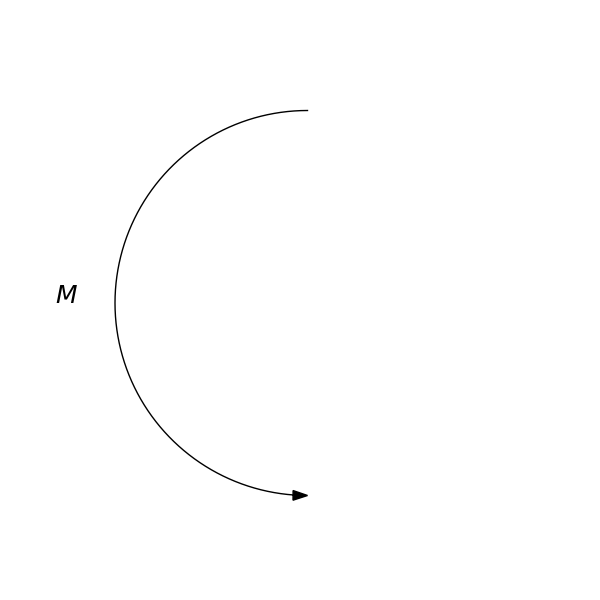
An example of
Moment.
- class pysketcher.Point(x, y)[source]
Bases:
objectImmutable Point class which implements basic point arithmetic.
- Parameters:
x (float) – float The x co-ordinate
y (float) – float The y co-ordinate
- static from_coordinate_lists(xs, ys)[source]
Generates points from lists of co-ordinates.
- Parameters:
xs (List[float]) – the x co-ordinates
ys (List[float]) – the y co-ordinates
- Returns:
A list of
Pointmade up of the respective co-ordinates.- Raises:
ValueError – When the co-ordinates lists are of different lengths.
- Return type:
List[Point]
- scale(factor)[source]
Scale point coordinates by factor:
x = factor*x, etc.- Parameters:
factor (float) – the amount the
Pointshould be scaled by.- Returns:
The scaled point.
- Return type:
- static to_coordinate_lists(ps)[source]
Generates lists of co-ordinates from points.
- Parameters:
ps (List[Point])
- Return type:
Tuple[List[float], List[float]]
- class pysketcher.RadialDimension(text, center, edge)[source]
Bases:
CompositionUsed to indicate radial distances.
Examples
>>> circle1 = ps.Circle(ps.Point(1.5, 1.5), 0.8)
>>> circle1.style.line_width = 1
>>> dim1 = RadialDimension(r"$r$", circle1.center, circle1(np.pi / 3))
>>>
>>> circle2 = ps.Circle(ps.Point(3.5, 1.5), 0.8)
>>> circle2.style.line_width = 1
>>> dim2 = RadialDimension(r"$r$", circle2.center, circle2(np.pi / 3))
>>> dim2.diameter = True
>>>
>>> circle3 = ps.Circle(ps.Point(5.5, 1.5), 0.8)
>>> circle3.style.line_width = 1
>>> dim3 = RadialDimension(r"$r$", circle3.center, circle3(np.pi / 3))
>>> dim3.center_mark = True
>>>
>>> circle4 = ps.Circle(ps.Point(7.5, 1.5), 0.8)
>>> circle4.style.line_width = 1
>>> dim4 = RadialDimension(r"$r$", circle4.center, circle4(np.pi / 3))
>>> dim4.center_line = True
>>>
>>> circle5 = ps.Circle(ps.Point(9.5, 1.5), 0.8)
>>> circle5.style.line_width = 1
>>> dim5 = RadialDimension(r"$r$", circle5.center, circle5(np.pi / 3))
>>> dim5.diameter = True
>>> dim5.center_line = True
>>>
>>> fig = ps.Figure(0, 11, 0, 3, backend=MatplotlibBackend)
>>> fig.add(circle1)
>>> fig.add(dim1)
>>> fig.add(circle2)
>>> fig.add(dim2)
>>> fig.add(circle3)
>>> fig.add(dim3)
>>> fig.add(circle4)
>>> fig.add(dim4)
>>> fig.add(circle5)
>>> fig.add(dim5)
>>> fig.save("pysketcher/images/radial_dimension.png")
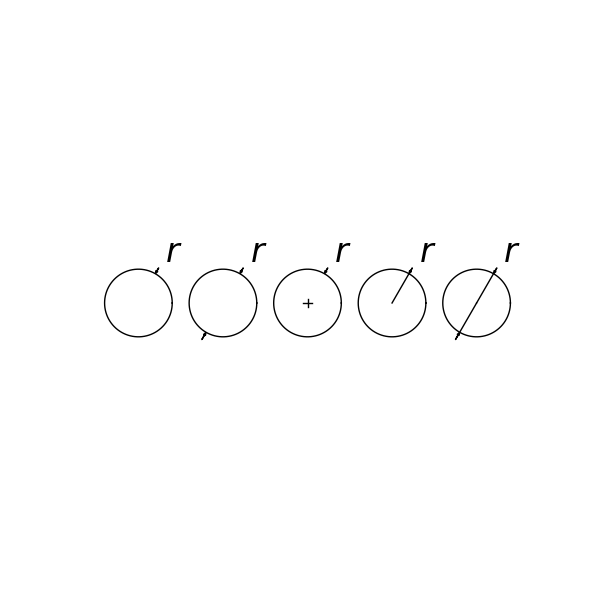
An example of
RadialDimension.
- class pysketcher.Rectangle(lower_left_corner, width, height)[source]
Bases:
CurveA representation of a rectangle.
Rectangle specified by the point lower_left_corner, width, and height.
- Parameters:
lower_left_corner (Point) – The point from which the
Rectangleshould be drawn.width (float) – The width of the
Rectangle.height (float) – The height of the
Rectangle.
Examples
>>> code = ps.Rectangle(ps.Point(1, 1), 3, 4)
>>> model = ps.Composition(dict(text=code))
>>> fig = ps.Figure(0, 5, 0, 5, backend=MatplotlibBackend)
>>> fig.add(model)
>>> fig.save("pysketcher/images/rectangle.png")
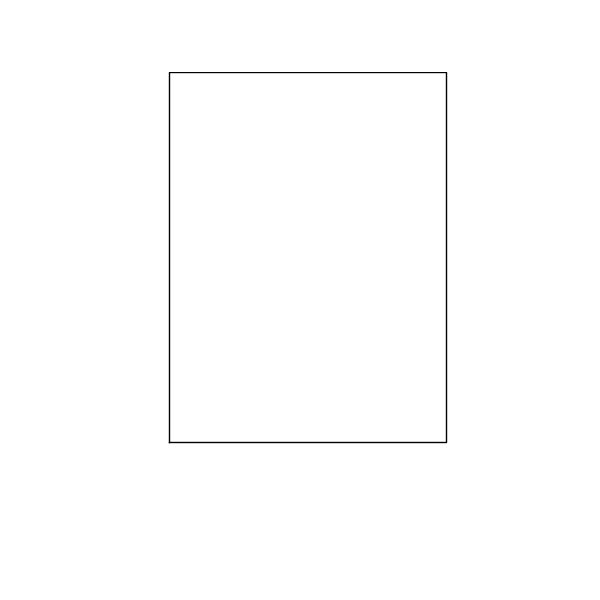
An example of
Rectangle.
- class pysketcher.Shape[source]
Bases:
StylableSuperclass for drawing different geometric shapes.
Subclasses define shapes, but drawing, rotation, translation, etc. are done in generic functions in this superclass.
- class pysketcher.SimpleSupport(position, size)[source]
Bases:
CompositionA representation of a simple support.
Often used in static load analysis, this shows a diagrammatic representation of a point support.
- Parameters:
position (Point) – The top of the simple support.
size (float) – The distance from the top of the simple support to the center of the base.
Examples
>>> s = ps.SimpleSupport(ps.Point(1.0, 1.0), 0.5)
>>> fig = ps.Figure(0, 2.0, 0, 1.5, backend=MatplotlibBackend)
>>> fig.add(s)
>>> fig.save("pysketcher/images/simple_support.png")
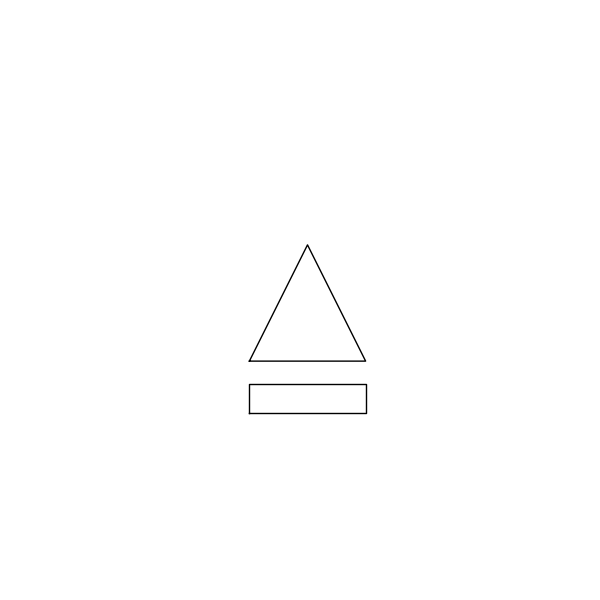
An example of
SimpleSupport.
- class pysketcher.SketchyFunc1(name=None, name_pos='start', x_min=0, x_max=6, y_min=0, y_max=2)[source]
Bases:
SplineA typical function curve used to illustrate an “arbitrary” function.
Examples
>>> f = ps.SketchyFunc1()
>>> fig = ps.Figure(0.0, 7.0, 0.0, 3.0, backend=MatplotlibBackend)
>>> fig.add(f)
>>> fig.save("pysketcher/images/sketchyfunc1.png")
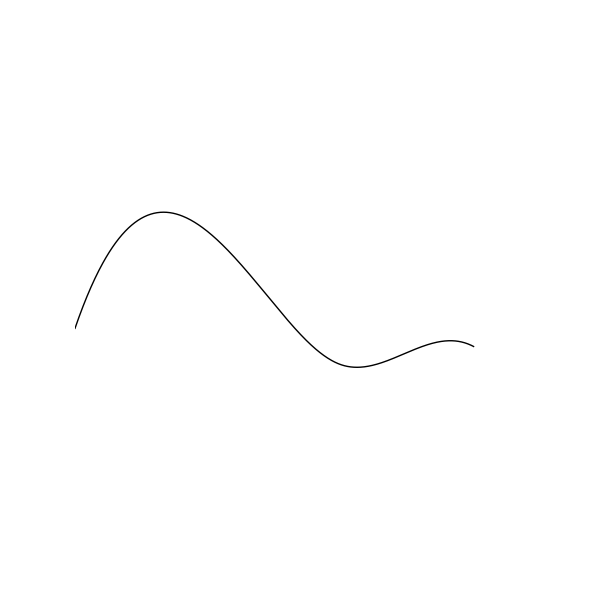
An example of
SketchyFunc1.
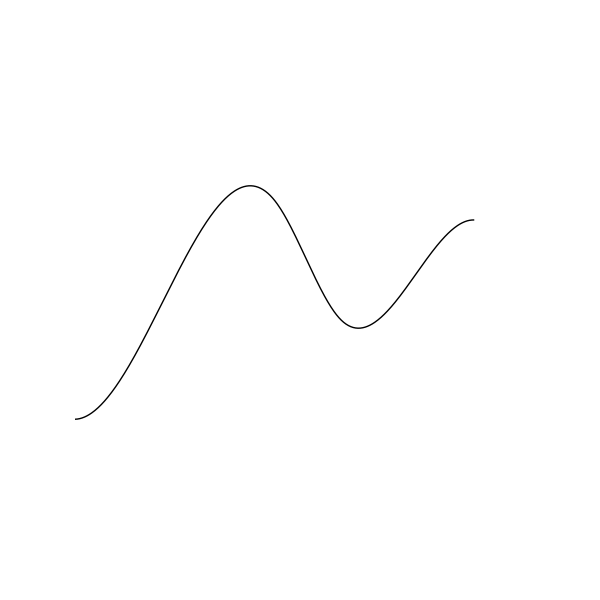
- class pysketcher.SketchyFunc2(x_min=0, x_max=2.25, y_min=0.046679703125, y_max=1.259375)[source]
Bases:
CurveA typical function curve used to illustrate an “arbitrary” function.
Examples
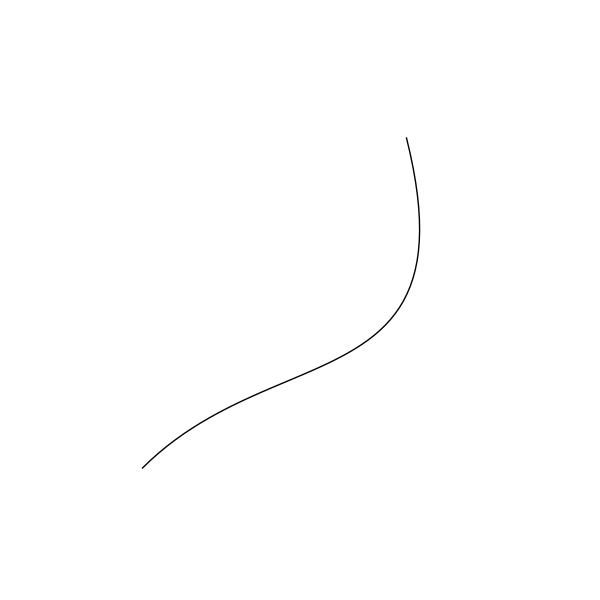
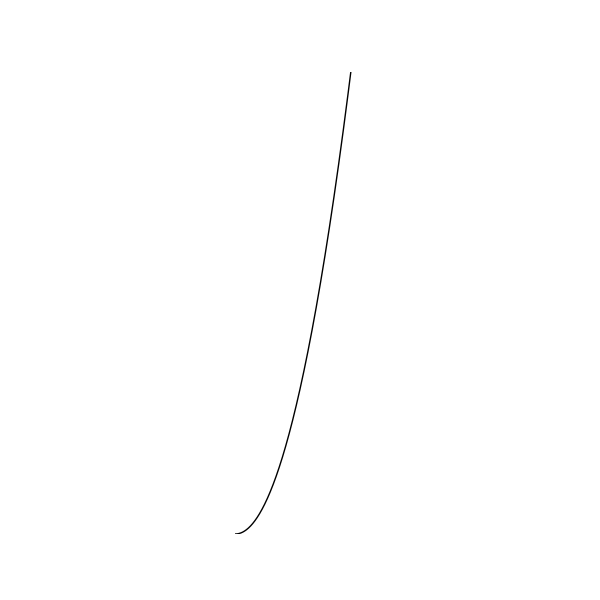
>>> f = ps.SketchyFunc2()
>>> fig = ps.Figure(0.0, 3.0, 0.0, 1.5, backend=MatplotlibBackend)
>>> fig.add(f)
>>> fig.save("pysketcher/images/sketchyfunc2.png")
An example of
SketchyFunc2.
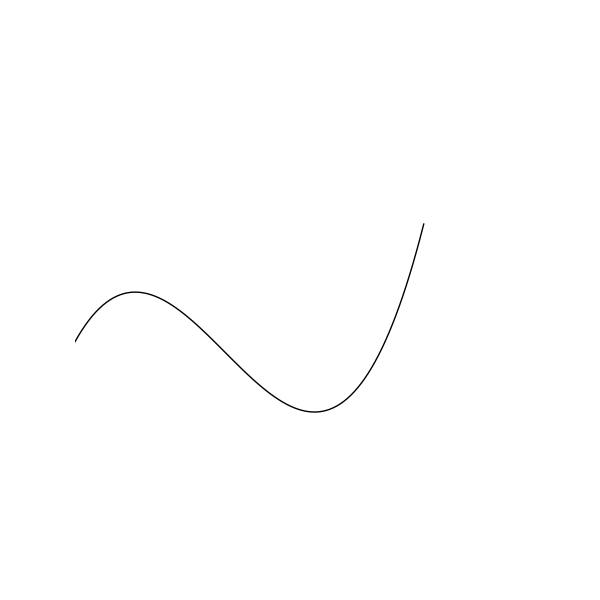
- class pysketcher.SketchyFunc3(x_min=0, x_max=6, y_min=0.5, y_max=3.8)[source]
Bases:
SplineA typical function curve used to illustrate an “arbitrary” function.
Examples
>>> f = ps.SketchyFunc3()
>>> fig = ps.Figure(0.0, 7.0, 0.0, 4.5, backend=MatplotlibBackend)
>>> fig.add(f)
>>> fig.save("pysketcher/images/sketchyfunc3.png")
An example of
SketchyFunc3.
- class pysketcher.SketchyFunc4(name_pos='start', x_min=0, x_max=6, y_min=0.5, y_max=1.8)[source]
Bases:
SplineA typical function curve used to illustrate an “arbitrary” function.
Can be a companion function to SketchyFunc3.
Examples
>>> f = ps.SketchyFunc4()
>>> fig = ps.Figure(0.0, 7.0, 0.0, 3.0, backend=MatplotlibBackend)
>>> fig.add(f)
>>> fig.save("pysketcher/images/sketchyfunc4.png")
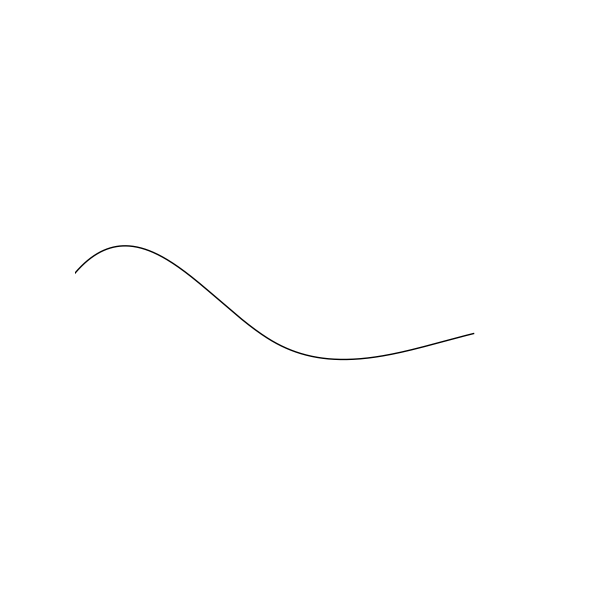
An example of
SketchyFunc4.
- class pysketcher.Spline(points, degree=3, resolution=501)[source]
Bases:
CurveA univariate spline.
- Note: UnivariateSpline interpolation may not work if
the x[i] points are far from uniformly spaced.
Examples
>>> s = ps.Spline(
...     [
...         ps.Point(0, 0),
...         ps.Point(1, 1),
...         ps.Point(2, 4),
...         ps.Point(3, 9),
...         ps.Point(4, 16),
...     ]
... )
>>> fig = ps.Figure(0, 5, 0, 16, backend=MatplotlibBackend)
>>> fig.add(s)
>>> fig.save("pysketcher/images/spline.png")
An example of
Spline.¶- Parameters:
points (List[Point])
degree (int)
resolution (int)
- class pysketcher.Spring(start, length, width=None, bar_length=None, num_windings=11, teeth=False)[source]
Bases:
CompositionA representation of a spring.
Specify a vertical spring, starting at start and with length as total vertical length. In the middle of the spring there are num_windings circular windings to illustrate the spring. If teeth is true, the spring windings look like saw teeth, otherwise the windings are smooth circles. The parameters width (total width of spring) and bar_length (length of first and last bar are given sensible default values if they are not specified (these parameters can later be extracted as attributes, see table below).
Examples
>>> L = 12.0
>>> H = L / 6.0
>>> start = ps.Point(0.0, 0.0)
>>> s = ps.Spring(start, L)
>>> fig = ps.Figure(-2, 2, -1, L + H, backend=MatplotlibBackend)
>>> fig.add(s)
>>> fig.save("pysketcher/images/spring.png")
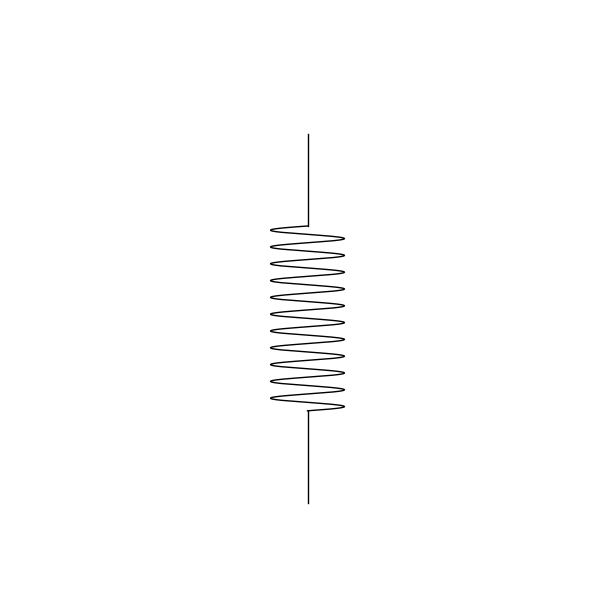
An example of a
Spring.¶- Parameters:
start (Point)
length (float)
width (float)
bar_length (float)
num_windings (int)
teeth (bool)
- class pysketcher.Style[source]
Bases:
objectRepresents the visual characteristics of a Drawable object.
- class ArrowStyle(value, names=None, *, module=None, qualname=None, type=None, start=1, boundary=None)[source]
Bases:
DocEnumRepresents the style of arrow which can adorn a line.
- class Color(value, names=None, *, module=None, qualname=None, type=None, start=1, boundary=None)[source]
Bases:
DocEnumRepresents the color in which something should be rendered.
- class FillPattern(value, names=None, *, module=None, qualname=None, type=None, start=1, boundary=None)[source]
Bases:
DocEnumRepresents the pattern in which something can be shaded.
- class LineStyle(value, names=None, *, module=None, qualname=None, type=None, start=1, boundary=None)[source]
Bases:
DocEnumRepresents the manner of line to be drawn.
- property arrow: ArrowStyle[source]
The arrow which should adorn the line.
- property fill_pattern: FillPattern[source]
The pattern of fill.
- class pysketcher.Text(text, position, direction=P(1.e+00, 0.e+00))[source]
Bases:
ShapePlace text on the drawing at the Point(x, y) position.
The text will be drawn in the given direction
- Parameters:
Examples
>>> fig = ps.Figure(0.0, 4.0, 0.0, 4.0, MatplotlibBackend)
>>> code = ps.Text("This is some left text!", Point(2, 1))
>>> code.style.alignment = ps.TextStyle.Alignment.LEFT
>>> code.style.line_color = ps.TextStyle.Color.BLUE
>>> code.style.font_family = ps.TextStyle.FontFamily.SERIF
>>> code1 = ps.Text("This is some right text!", Point(2, 2))
>>> code1.style.alignment = ps.TextStyle.Alignment.RIGHT
>>> code1.style.line_color = ps.TextStyle.Color.GREEN
>>> code1.style.font_family = ps.TextStyle.FontFamily.SANS
>>> code2 = ps.Text("This is some center text!", Point(2, 3))
>>> code2.style.alignment = ps.TextStyle.Alignment.CENTER
>>> code2.style.line_color = ps.TextStyle.Color.RED
>>> code2.style.font_family = ps.TextStyle.FontFamily.MONO
>>> fig.add(code)
>>> fig.add(code1)
>>> fig.add(code2)
>>> fig.save("pysketcher/images/text.png")
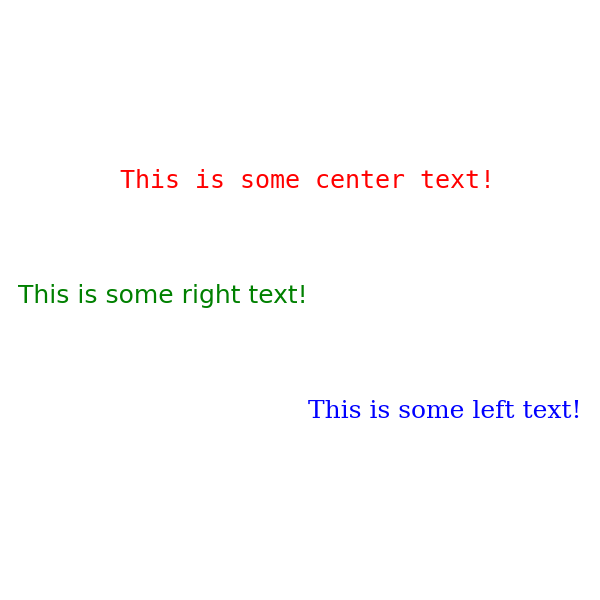
An example of some
Text.¶- scale(factor)[source]
Scales the text by a factor of factor.
- Parameters:
factor (float)
- Return type:
- class pysketcher.TextPosition(value, names=None, *, module=None, qualname=None, type=None, start=1, boundary=None)[source]
Bases:
EnumSpecifies the position of text in Annotations.
- class pysketcher.TextStyle[source]
Bases:
StyleRepresents the visual style of a text object.
- class Alignment(value, names=None, *, module=None, qualname=None, type=None, start=1, boundary=None)[source]
Bases:
DocEnumRepresents the horizontal alignment of text.
- class FontFamily(value, names=None, *, module=None, qualname=None, type=None, start=1, boundary=None)[source]
Bases:
DocEnumRepresents the font which should be used to render text.
- property font_family: FontFamily[source]
The family of font in which text is rendered.
- class pysketcher.Triangle(p1, p2, p3)[source]
Bases:
CurveTriangle defined by its three vertices p1, p2, and p3.
- Parameters:
Examples
>>> model = ps.Triangle(ps.Point(1, 1), ps.Point(1, 4), ps.Point(3, 3))
>>> fig = ps.Figure(0, 5, 0, 5, backend=MatplotlibBackend)
>>> fig.add(model)
>>> fig.save("pysketcher/images/triangle.png")

An example of
Triangle.¶- rotate(angle, center)[source]
Rotates the Triangle through a
angleaboutcenter.- Parameters:
angle (float) – The angle through which the triangle should be rotated in radians.
center (Point) – The point about which the triangle should be rotated.
- Returns:
A copy of the triangle subjected to the specified rotation.
- class pysketcher.UniformLoad(lower_left_corner, width, height, num_arrows=10)[source]
Bases:
CompositionDownward-pointing arrows indicating a vertical load.
The arrows are of equal length and filling a rectangle specified as in the
Rectangleclass.Examples
>>> l = ps.UniformLoad(ps.Point(0.5, 0.5), 4, 0.5)
>>> fig = ps.Figure(0.0, 5.0, 0.0, 1, backend=MatplotlibBackend)
>>> fig.add(l)
>>> fig.save("pysketcher/images/uniform_load.png")
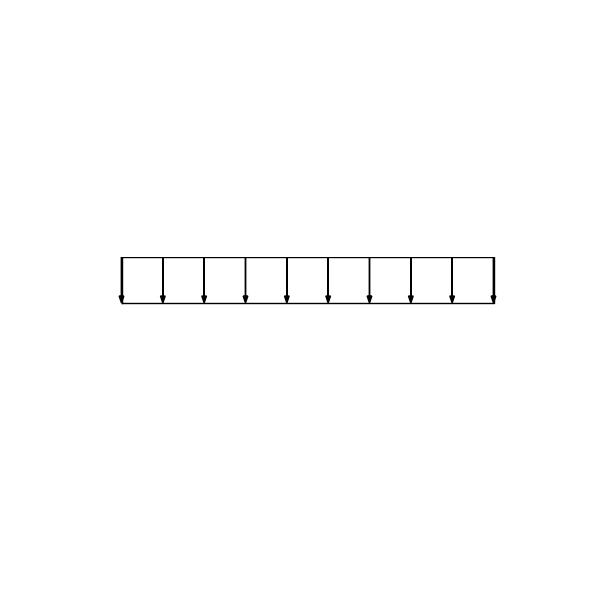
An example of a
UniformLoad.¶- Parameters:
lower_left_corner (Point)
width (float)
height (float)
- class pysketcher.VelocityProfile(start, height, profile, num_arrows, scaling=1)[source]
Bases:
CompositionA representation of the profile of velocity in laminar flow.
- Parameters:
Examples
>>> def velocity_profile(y: float) -> ps.Point:
...     return ps.Point(y * (8 - y) / 4, 0)
>>> pr = ps.VelocityProfile(ps.Point(0, 0), 4, velocity_profile, 5)
>>> fig = ps.Figure(0, 4.1, 0, 4, backend=MatplotlibBackend)
>>> fig.add(pr)
>>> fig.save("pysketcher/images/velocity_profile.png")
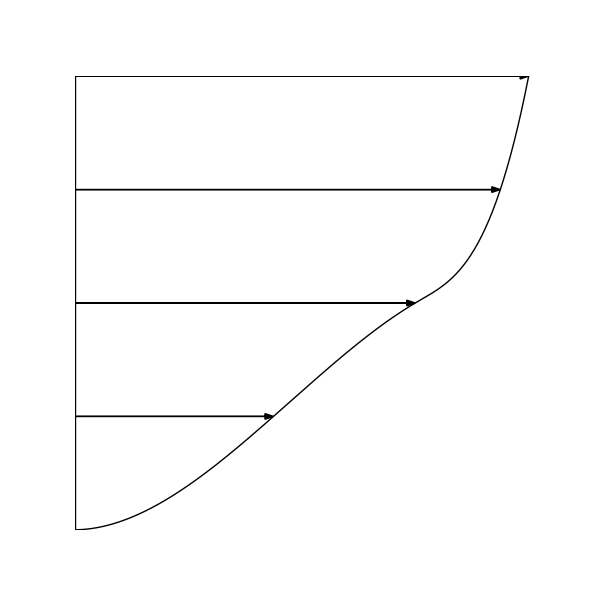
An example of
VelocityProfile.
- class pysketcher.Wall(points, thickness)[source]
Bases:
CurveA representation of a wall.
- Parameters:
points (List[Point]) – a
ListofPointthrough which the wall should pass.thickness (float) – the thickness of the wall.
Examples
>>> model = ps.Wall(
...     [
...         ps.Point(1, 1),
...         ps.Point(2, 2),
...         ps.Point(3, 2.5),
...         ps.Point(4, 2),
...         ps.Point(5, 1),
...     ],
...     0.1,
... )
>>> fig = ps.Figure(0, 6, 0, 3, backend=MatplotlibBackend)
>>> fig.add(model)
>>> fig.save("pysketcher/images/wall.png")
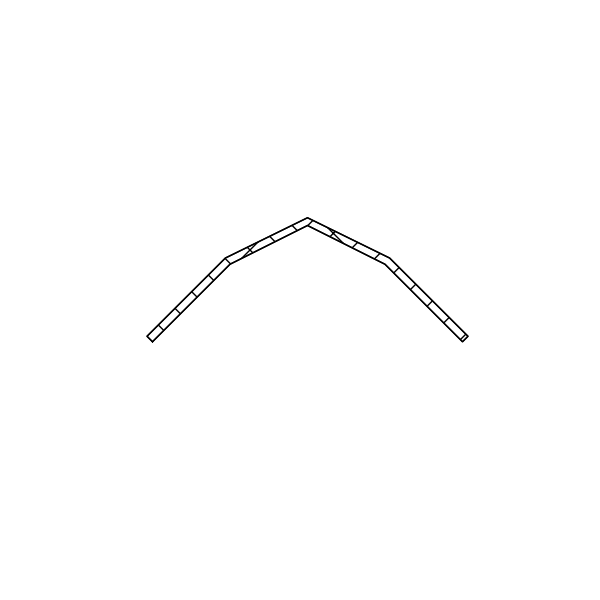
An example
Wall.
- class pysketcher.Wheel(center, radius, inner_radius=None, nlines=10)[source]
Bases:
CompositionA representation of a wheel.
- Parameters:
center (Point) – The center of the
Wheel.radius (float) – The radius of the
Wheel.inner_radius (float) – The radius of the hub of the
Wheel.nlines (int)
Examples
>>> w = ps.Wheel(ps.Point(1.0, 1.0), 0.5, 0.25)
>>> fig = ps.Figure(0.0, 2.0, 0.0, 2.0, backend=MatplotlibBackend)
>>> fig.add(w)
>>> fig.save("pysketcher/images/wheel.png")
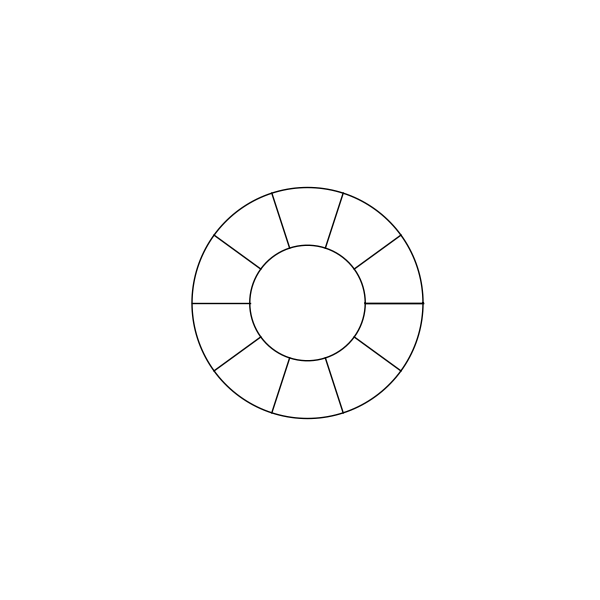
An example of a
Wheel.